
The main types of trading indicators you should know
For profitable trading, you should know which types of indicators to use and how to group them for grasping the maximum benefits

To become a trader and make a decent amount of money, the first thing you need to do is to develop an adequate strategy. Trading requires making numerous decisions, and one of the most important ones is choosing which indicators to use for identifying potentially profitable signals.
When you enter the world of technical analysis, you will see that there is a plethora of indicators and tools available. As a trader, you should understand the main notions behind each of the indicators and how they are categorised.
Technical indicators have three essential functions: they provide alerts, confirm and predict price behaviour. Therefore, your trading strategy should include indicators that complement each other and are able to fulfill the intended functions adequately.
Technical indicators are based on mathematical calculations and statistics. They use the historical trading data for the reference assets (or market) aimed at measuring different characteristics of the asset or its price. Technical analysis traders normally use multiple indicators because this allows them to examine multiple aspects of the price behaviour. For example, you can confirm your signals by collecting information regarding the asset's trend, volatility, traded volume, etc.
The starting point is to distinguish between the different types of indicators based on their ability to predict the price or determine the signal after the price action. The indicators are categorised as:
- Leading indicators are a type of indicator with the ability to anticipate the future price movement. Because of their predictive power, traders commonly use these indicators to identify potential price reversals prior to the reversal.
The negative side of relying solely on leading indicators is that they can provide multiple false signals because they are anticipating the price direction and level ahead of time. You can confirm these signals using the lagging indicators, but this would mean that a chunk of profit has been lost when entering the position after the confirmation.
Examples of leading indicators are the relative strength index (RSI), Stochastic oscillator, Williams %R, momentum, Commodity Channel Index (CCI), Parabolic SAR, on-balance volume (OBV) and Chaikin oscillator.
- Lagging indicators are indicators that follow the price and they usually provide signals after the price changes occurred. The indicators can be used to confirm the alerts and signals from other indicators.
Common examples of lagging indicators are the moving averages, moving average convergence divergence (MACD), Bollinger Bands, Average True Range, Standard Deviation and the volume rate of change.
Even though all indicators are based on historical data, the leading indicators are commonly considered to be superior to the lagging indicators because of their ability to forecast the future price movement. Nevertheless, traders tend to use leading indicators in confluence with lagging indicators. In terms of the aspect analysed by the indicators, they can be separated into four basic categories, which are volume indicators, trend indicators, momentum indicators and volatility indicators.
Volume indicators measure the changes in volume levels of the underlying asset and they could be a helpful tool for confirmation of trend strength. They measure the level of interest for a specific asset through the buying and selling activity. Traders may avoid opening positions during low volume periods because it could be an indication of a ranging market when false alerts may appear. Some of the volume indicators are:
- Market volume;
- Chaikin oscillator;
- On-balance volume (OBV); and
- Volume oscillator.
Trend indicators will help you determine the overall direction of the trend and you are able to identify trending market conditions or range-bound markets. They are based on some form of an average value of the price and they are useful because you have the possibility to trade in the trend direction. Commonly-used trend indicators are:
- Simple and exponential moving averages;
- Moving average convergence divergence;
- Triple exponential average;
- Average directional index;
- Aroon indicator.
Momentum indicators should be part of your trading strategy because they provide you with information about the trend strength. Using these indicators, you can also determine potential reversals when the trend is losing strength. The indicators value commonly oscillate around a baseline within a predefined range, but their oscillation may not be bounded within a range. Since the momentum measures the rate of change, a swift increase in price will result in strong momentum, while slower price changes will indicate a weak momentum. Popular momentum indicators are:
Volatility indicators consider the price changes in a certain period, which is an important characteristic of every market and every asset. Knowing the volatility may help you make a profit with more volatile assets and during higher volatility, a trend can be easily formed. Lack of volatility can indicate a low possibility that you will find a profitable trading opportunity because the price doesn't change. Some of the technical indicators which fall under the volatility type of indicators are:
The indicators help you define your trading position based on the signals you get from them. Having the right combination of indicators in your strategy can bring you profit. Although some of them can be applied as a standalone indicator, they should cover different aspects of a price so that you could confirm the trading signals.
Besides, you should also be familiar with how different indicators work and what they measure. Putting too many indicators on your chart will not increase your chance of finding a profitable position. The result can be hard to read and oversaturated chart, which will provide too much information and maybe redundant signals if you use the same types of indicators. Try to avoid indicator saturated trading strategies because more indicators don't always mean better and more accurate signals.
The indicators can also be categorised as primary or secondary based on the data they used in their calculations. The primary indicators are calculated with the basic market data, while the secondary indicators employ data obtain from the primary indicators. Technical indicators can also be grouped on the bases of the way their value moves, such as overlays or oscillators. You can also see a group of indicators referred to as support and resistance indicators.
How to use trading indicators
- Always test your technical analysis set-up – before you enter a trading position, check the validity and accuracy of the selected indicator and make sure that you identified a pattern and the alerts are valid;
- Plotting a lot of indicators on your chart can provide misleading alerts and be confusing;
- Always identify the correct market conditions – because in a ranging market, some indicators can provide false signals;
- If possible, incorporate basic fundamental analysis in your trading strategies; and
- Start trading by focusing on a couple of assets. Don't try to find patterns in a large number of assets.
Let’s see examples of a stand-alone indicator where multiple indicators are plotted and what a saturated chart would look like. The following graph provides an overview of a chart when you plot one type of indicator.
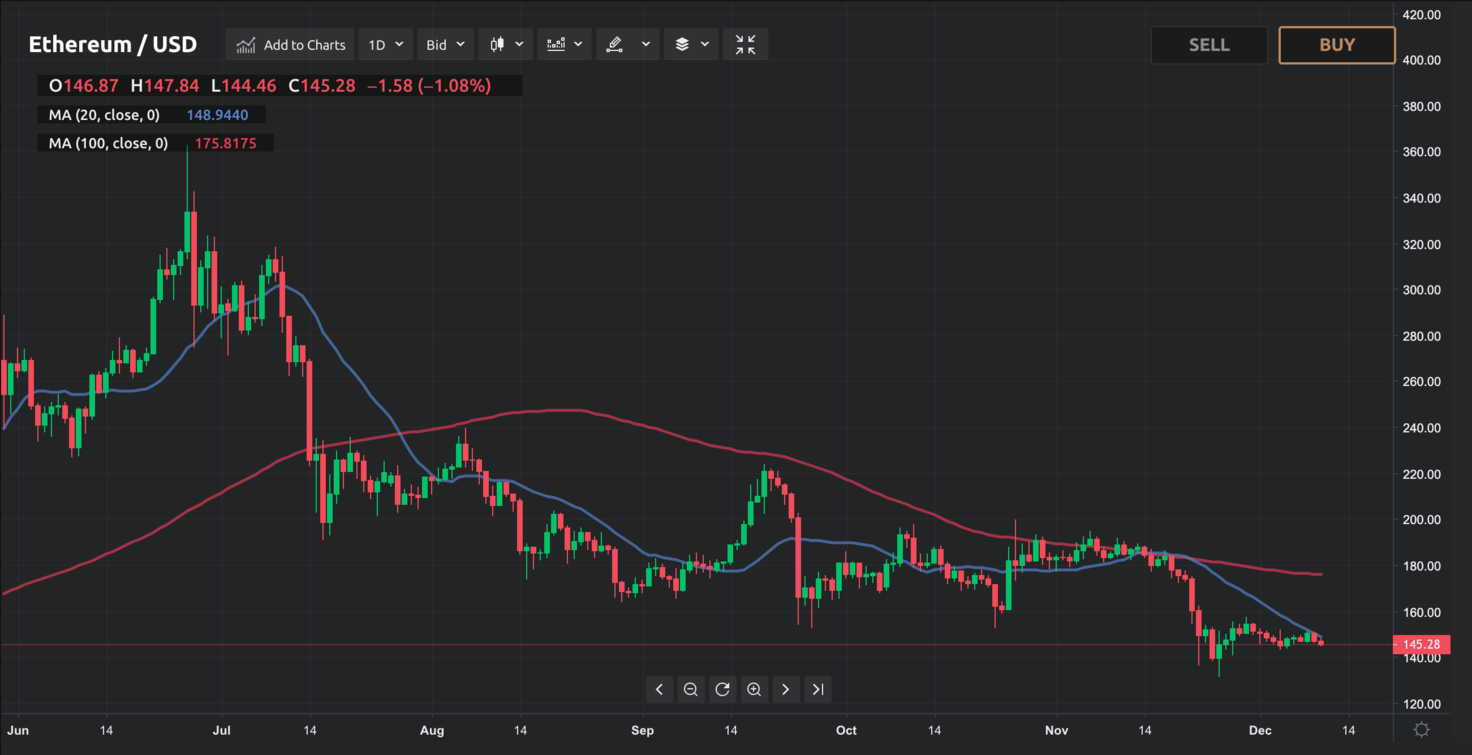
This is how a graph would look like if you plot two moving averages lines: a short-term(blue) line and long-term, red, line. You can see that the moving averages point toward a bearish crossover signal when the short moving average crosses below the long-term moving average.
Now let's look at the same chart, but we include an additional indicator, such as the MACD, which is a momentum indicator.

While the moving average (MA) indicator provides signals of a bearish crossover, using the MACD indicator histogram, we can see that the momentum is not very strong, meaning that the trend is not strong.
An example of the same chart where we plot many indicators is provided in the following graph.

The graph shows how a chart would look when you plot seven indicators at the same time. There are two moving averages (MAs), MACD, Bollinger Band, RSI, On-balance volume and average true range.
So, can you extract information or a signal from the graph without being buried under too much information? To avoid this, try to find an adequate combination and an adequate number of indicators for your asset and keep your chart simple.
Also, make sure that you use indicators that will complement each other because using only one type of indicator will mean that certain price behaviour is not considered in your analysis.


